

 Stripe
 Chargebee
 Recurly
 PayPal
 Tango Card
 Webhooks
 Zapier


Learn more
Built for startups,
scaled for unicorns
Successfully submitted!
Error! Please try again
See what it takes to set up a referral/affiliate program
Explore GrowSurf's powerful referral marketing platform
Watch a video demo of setting up a referral/affiliate program
GrowSurf plugs into your existing tools
GrowSurf vs other referral software providers
Explore our free suite of referral marketing tools.
Explore our free suite of tools built for startups.
Get discounts on top software and services like Notion, Deel, Apollo, and 1Password.
Explore Deals →
Our free loyalty software lets you reward your customers when they leave reviews, share on social media, and mention your brand.
Get It Free →Can you guess which startups made these growth tactics famous? Test your knowledge of innovative marketing strategies that led to explosive growth.
Play Now →
Want the full setup walkthrough?
Use these docs for exact setup steps, supported fields, and troubleshooting.
GrowSurf's Salesforce integration gives you a reporting foundation by writing referral-specific fields onto Salesforce contacts. Once those fields are visible in the CRM, your revenue team can build reports and dashboards around referred contacts, active referrers, and milestone progress without maintaining a second spreadsheet.
The cleanest reporting setup is simple: let GrowSurf write the referral truth, then let Salesforce handle the views, filters, dashboards, and internal distribution of that data.
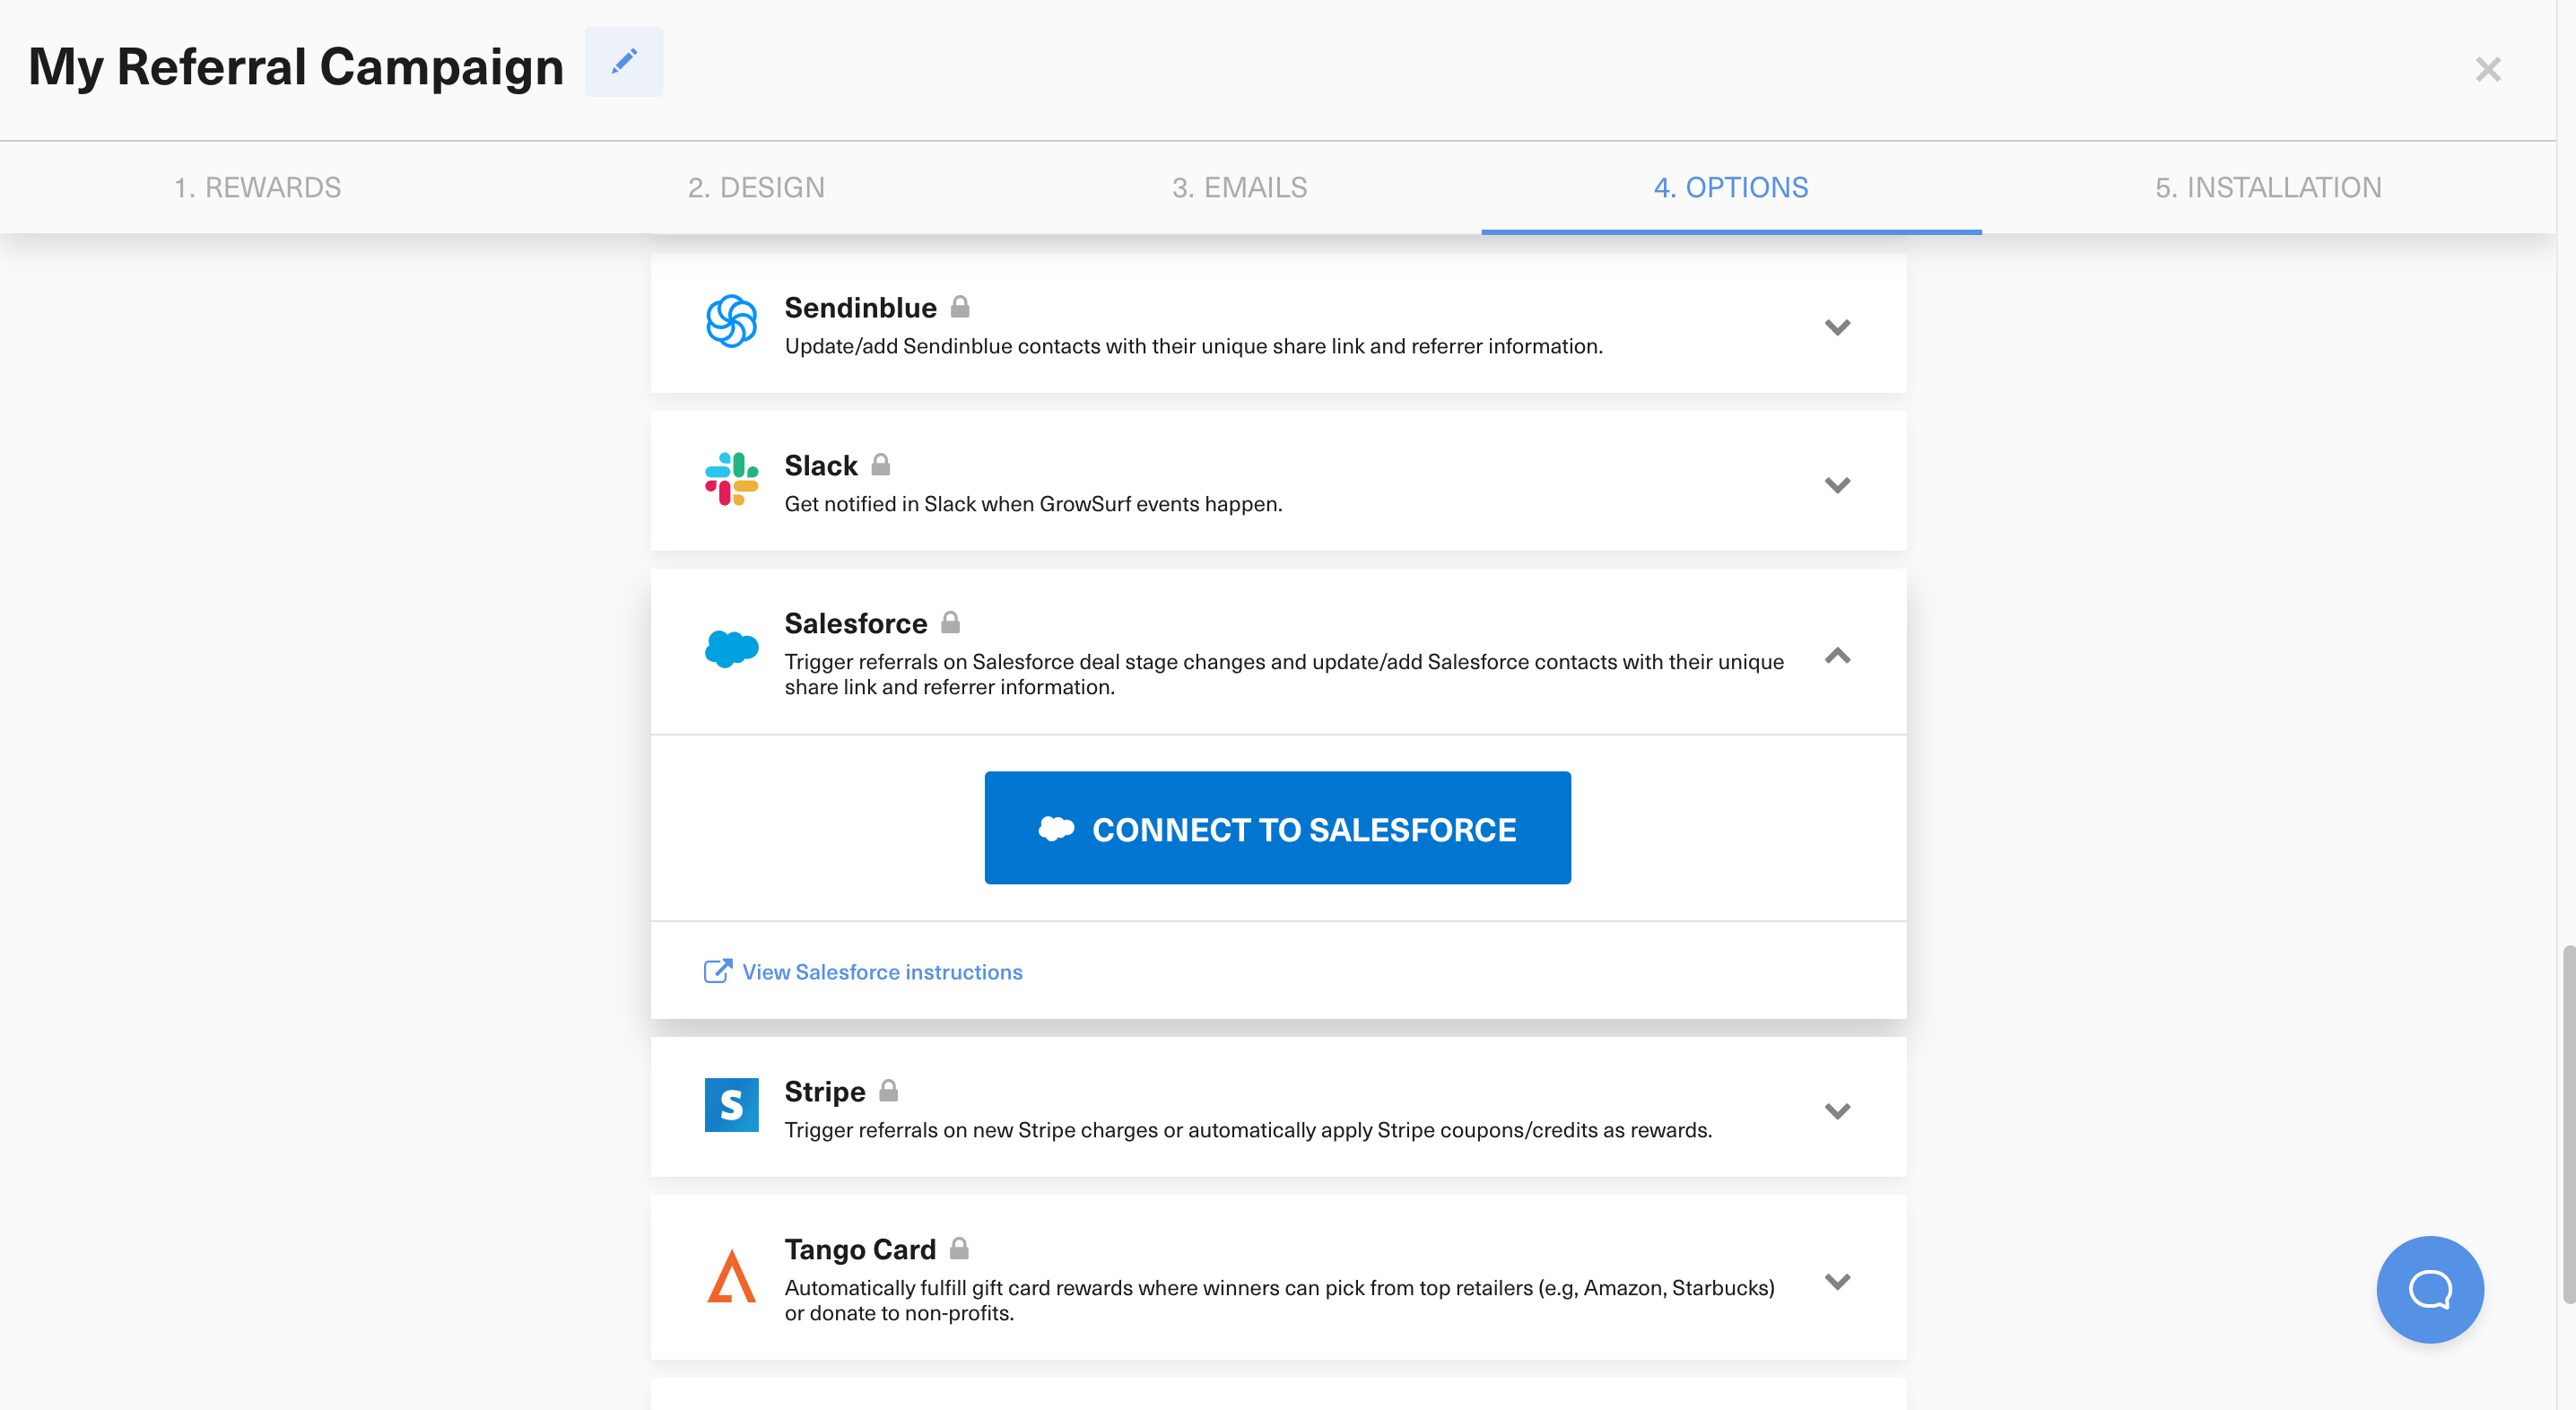
Connect Salesforce in GrowSurf before participants start entering the campaign. If the sync is enabled late, some of the contact records your team expects to report on may not have the GrowSurf fields yet.
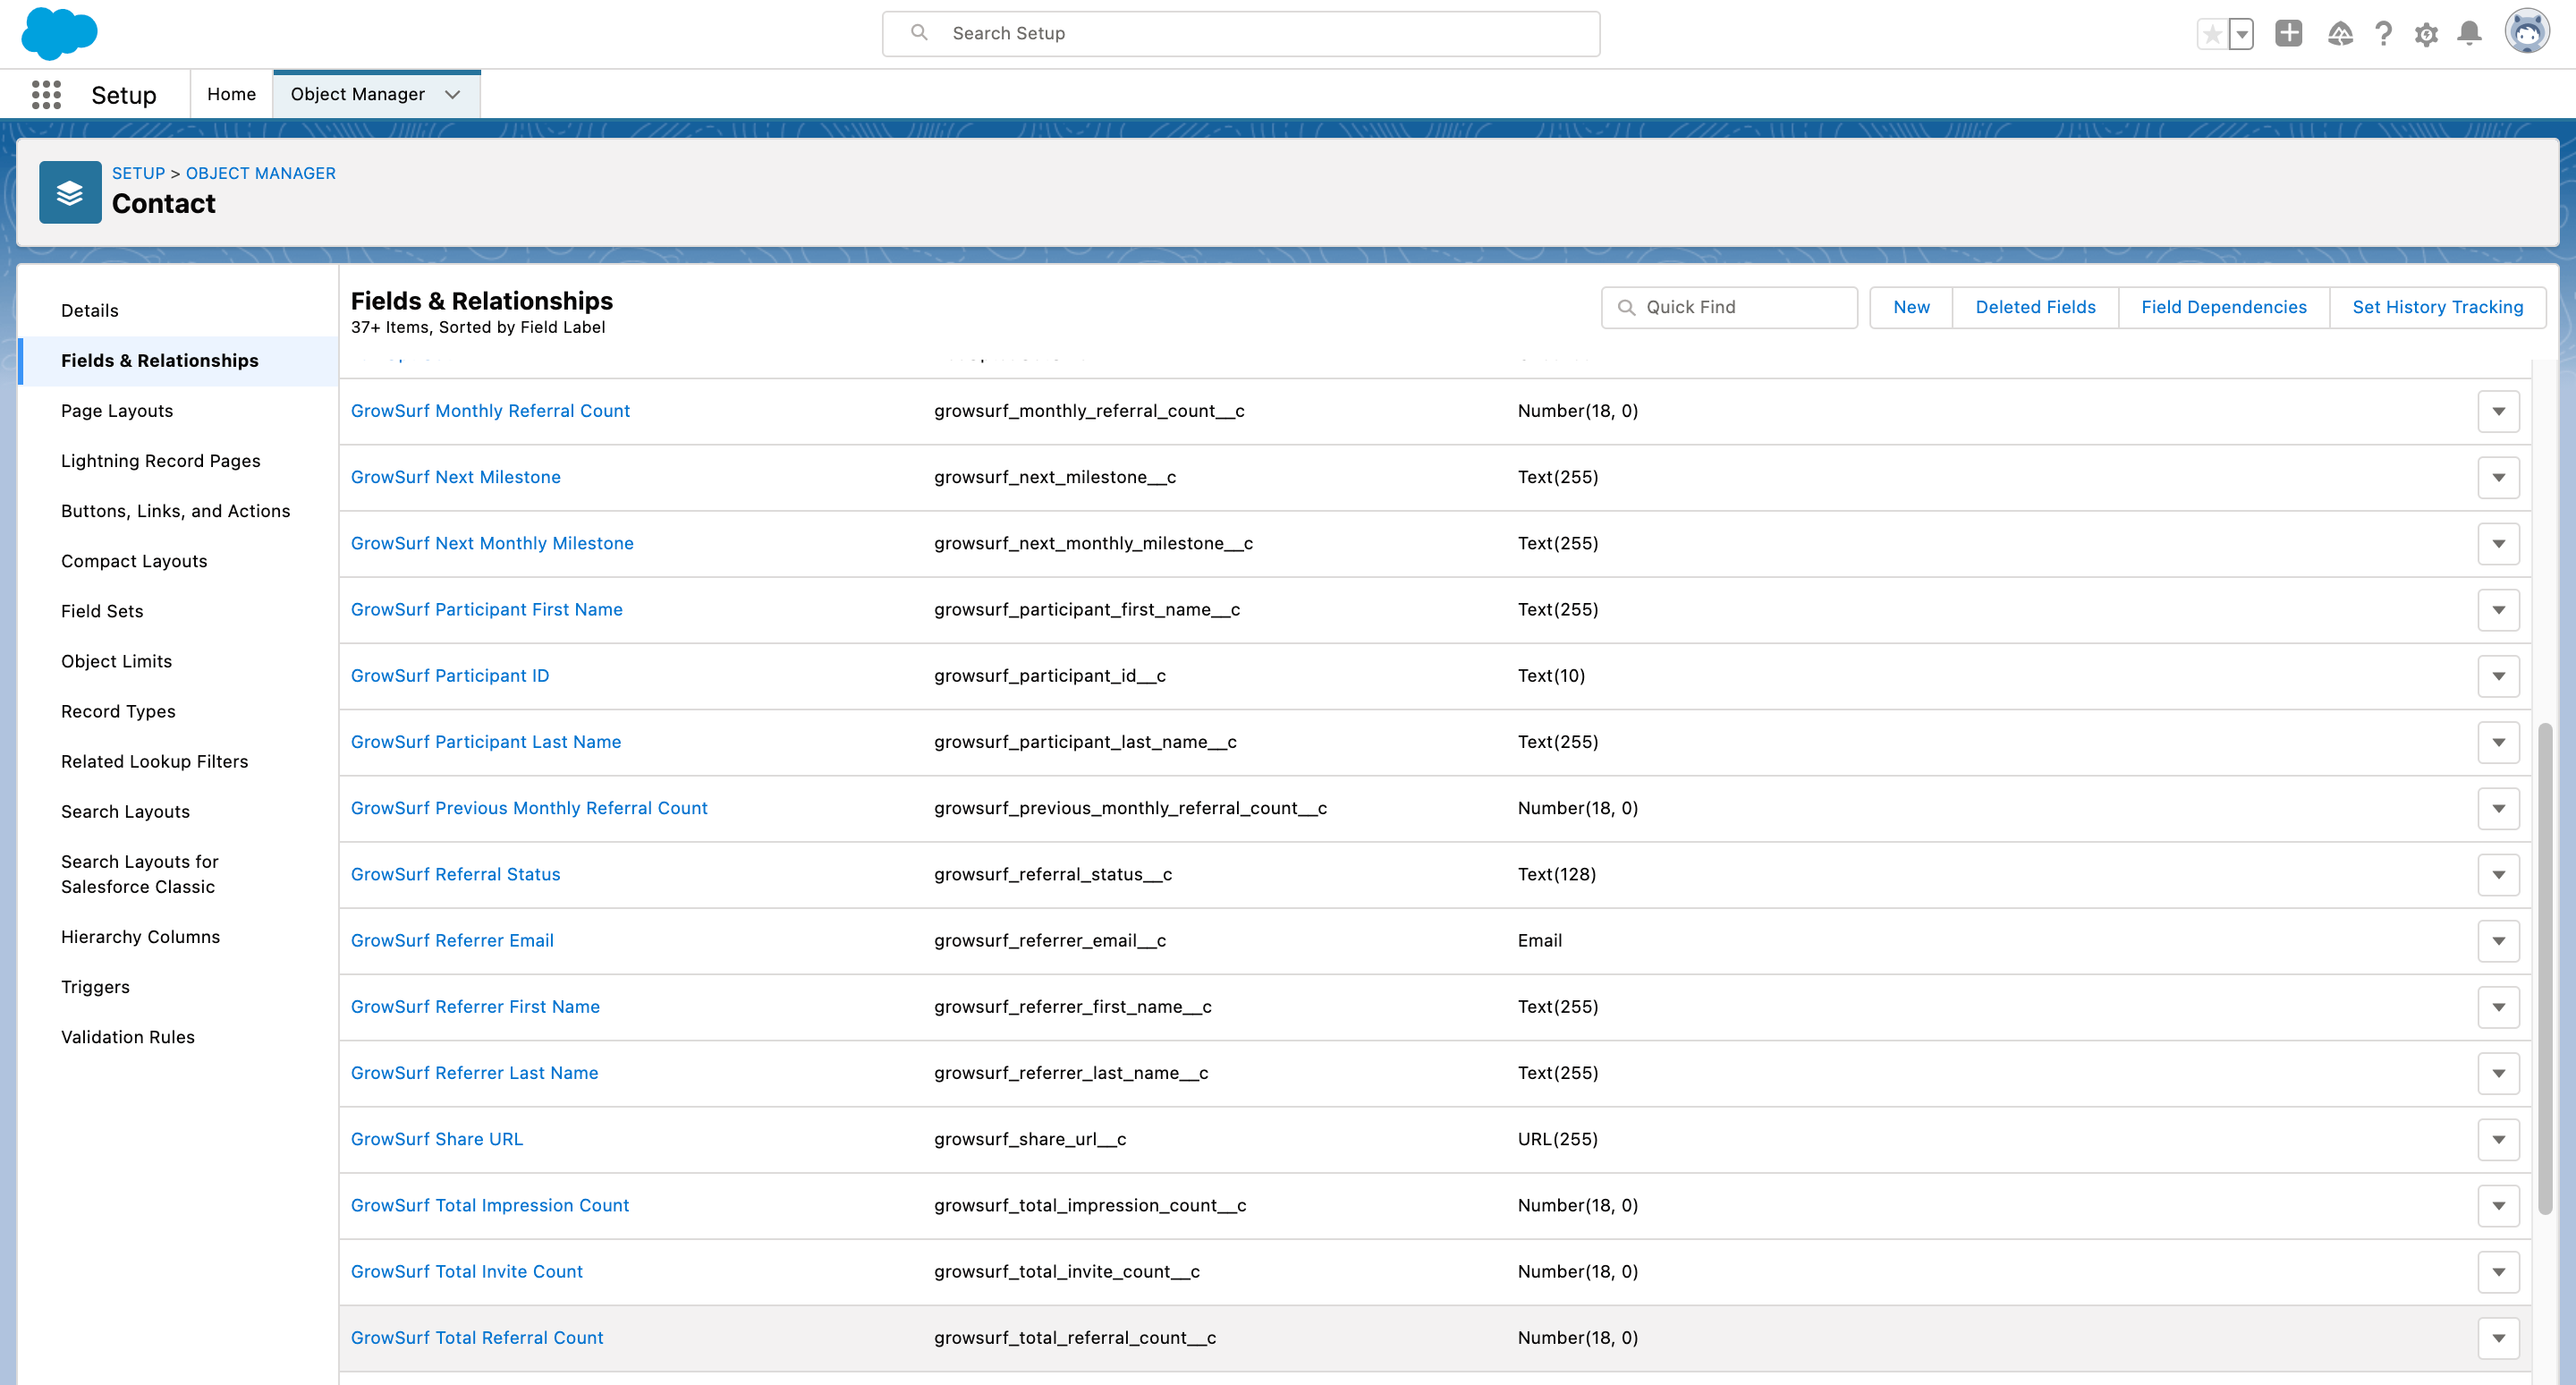
Start with fields such as growsurf_referral_status__c, growsurf_total_referral_count__c, growsurf_referrer_email__c, and growsurf_share_url__c. Those are usually enough to separate referred contacts from non-referred contacts and to show which participants are actually driving pipeline.
If your program uses GrowSurf's Salesforce Referral Trigger, combine the synced GrowSurf contact fields with the opportunity stage you chose for referral credit. That gives you a cleaner view of who referred someone, who qualified, and where that opportunity sits in pipeline today.
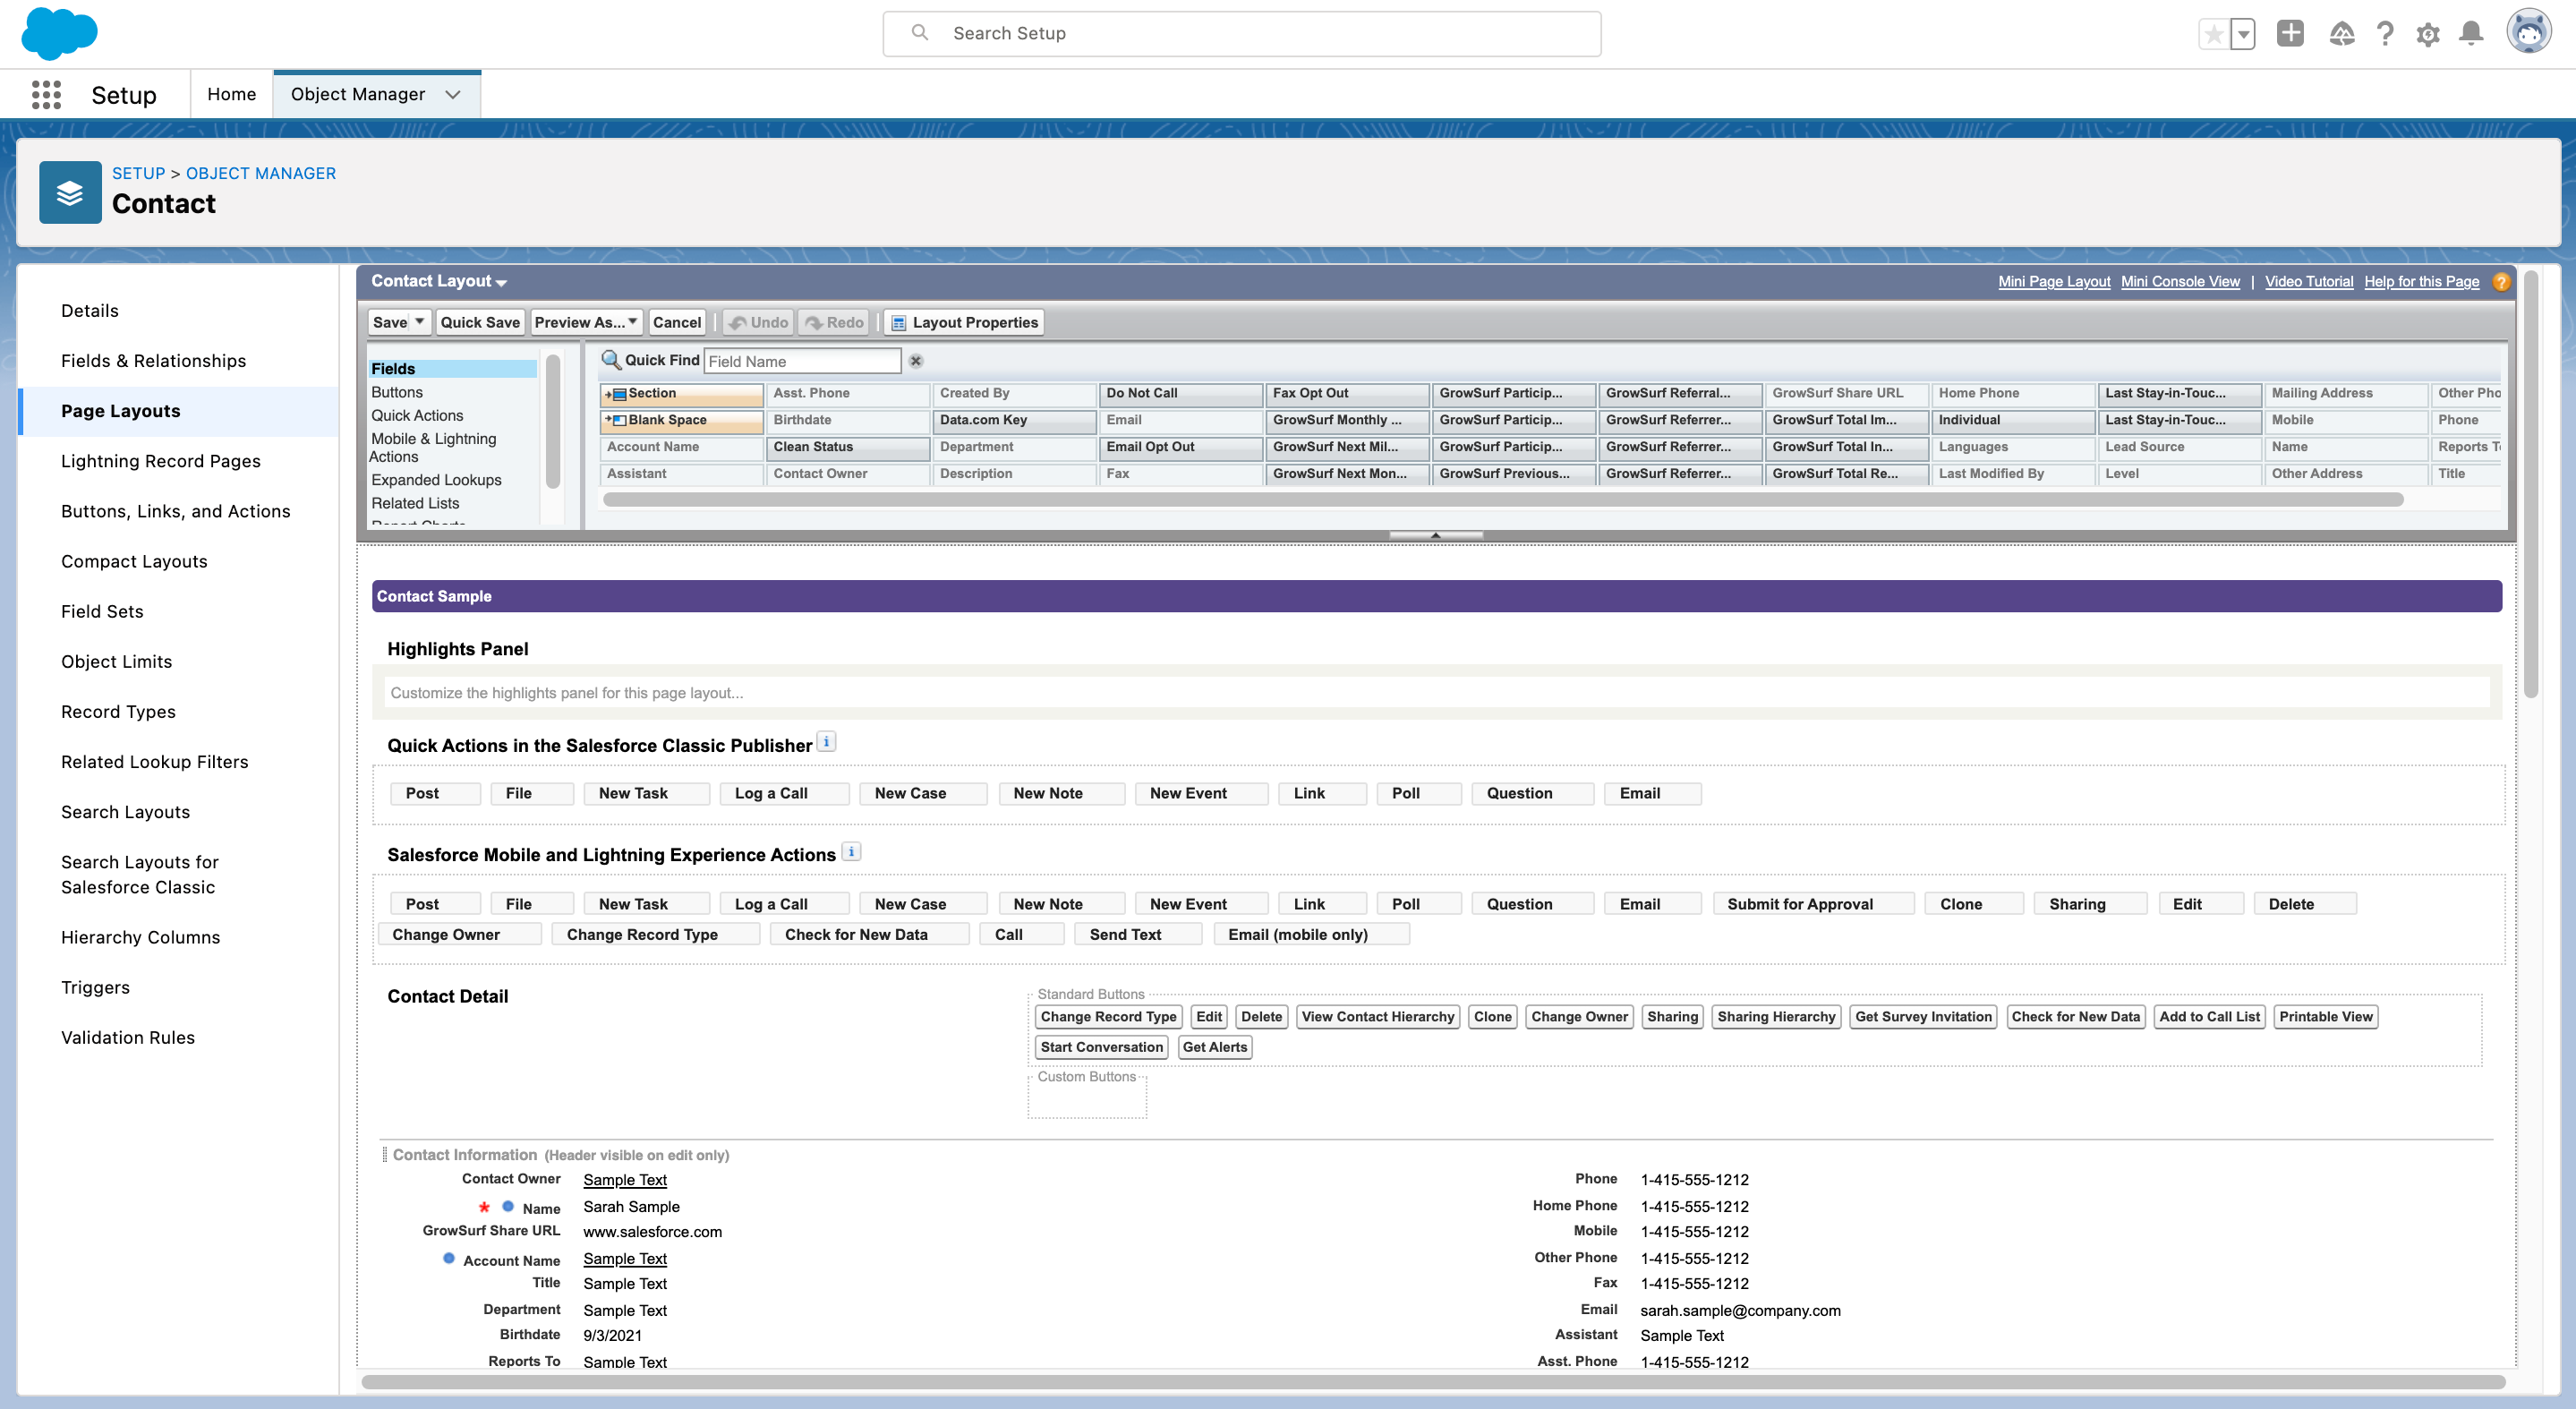
Pick several participants whose referral state you can confirm in GrowSurf, then verify that the same records show the expected fields and filters in Salesforce. That catches missing layout access and bad report logic before the dashboard becomes part of regular pipeline reviews.
Your dashboard is only as trustworthy as the fields underneath it. Let GrowSurf keep those fields current and avoid manual edits inside Salesforce that make the report drift from the real referral state.
The fastest useful dashboard is often a comparison between contacts who have GrowSurf referral context and the rest of the CRM. That baseline helps you see whether referral-driven pipeline is actually behaving differently.
If your team is not using the Salesforce Referral Trigger, keep the reporting centered on synced participant fields. Add opportunity-stage reporting only when stage changes are truly part of the GrowSurf qualification logic.
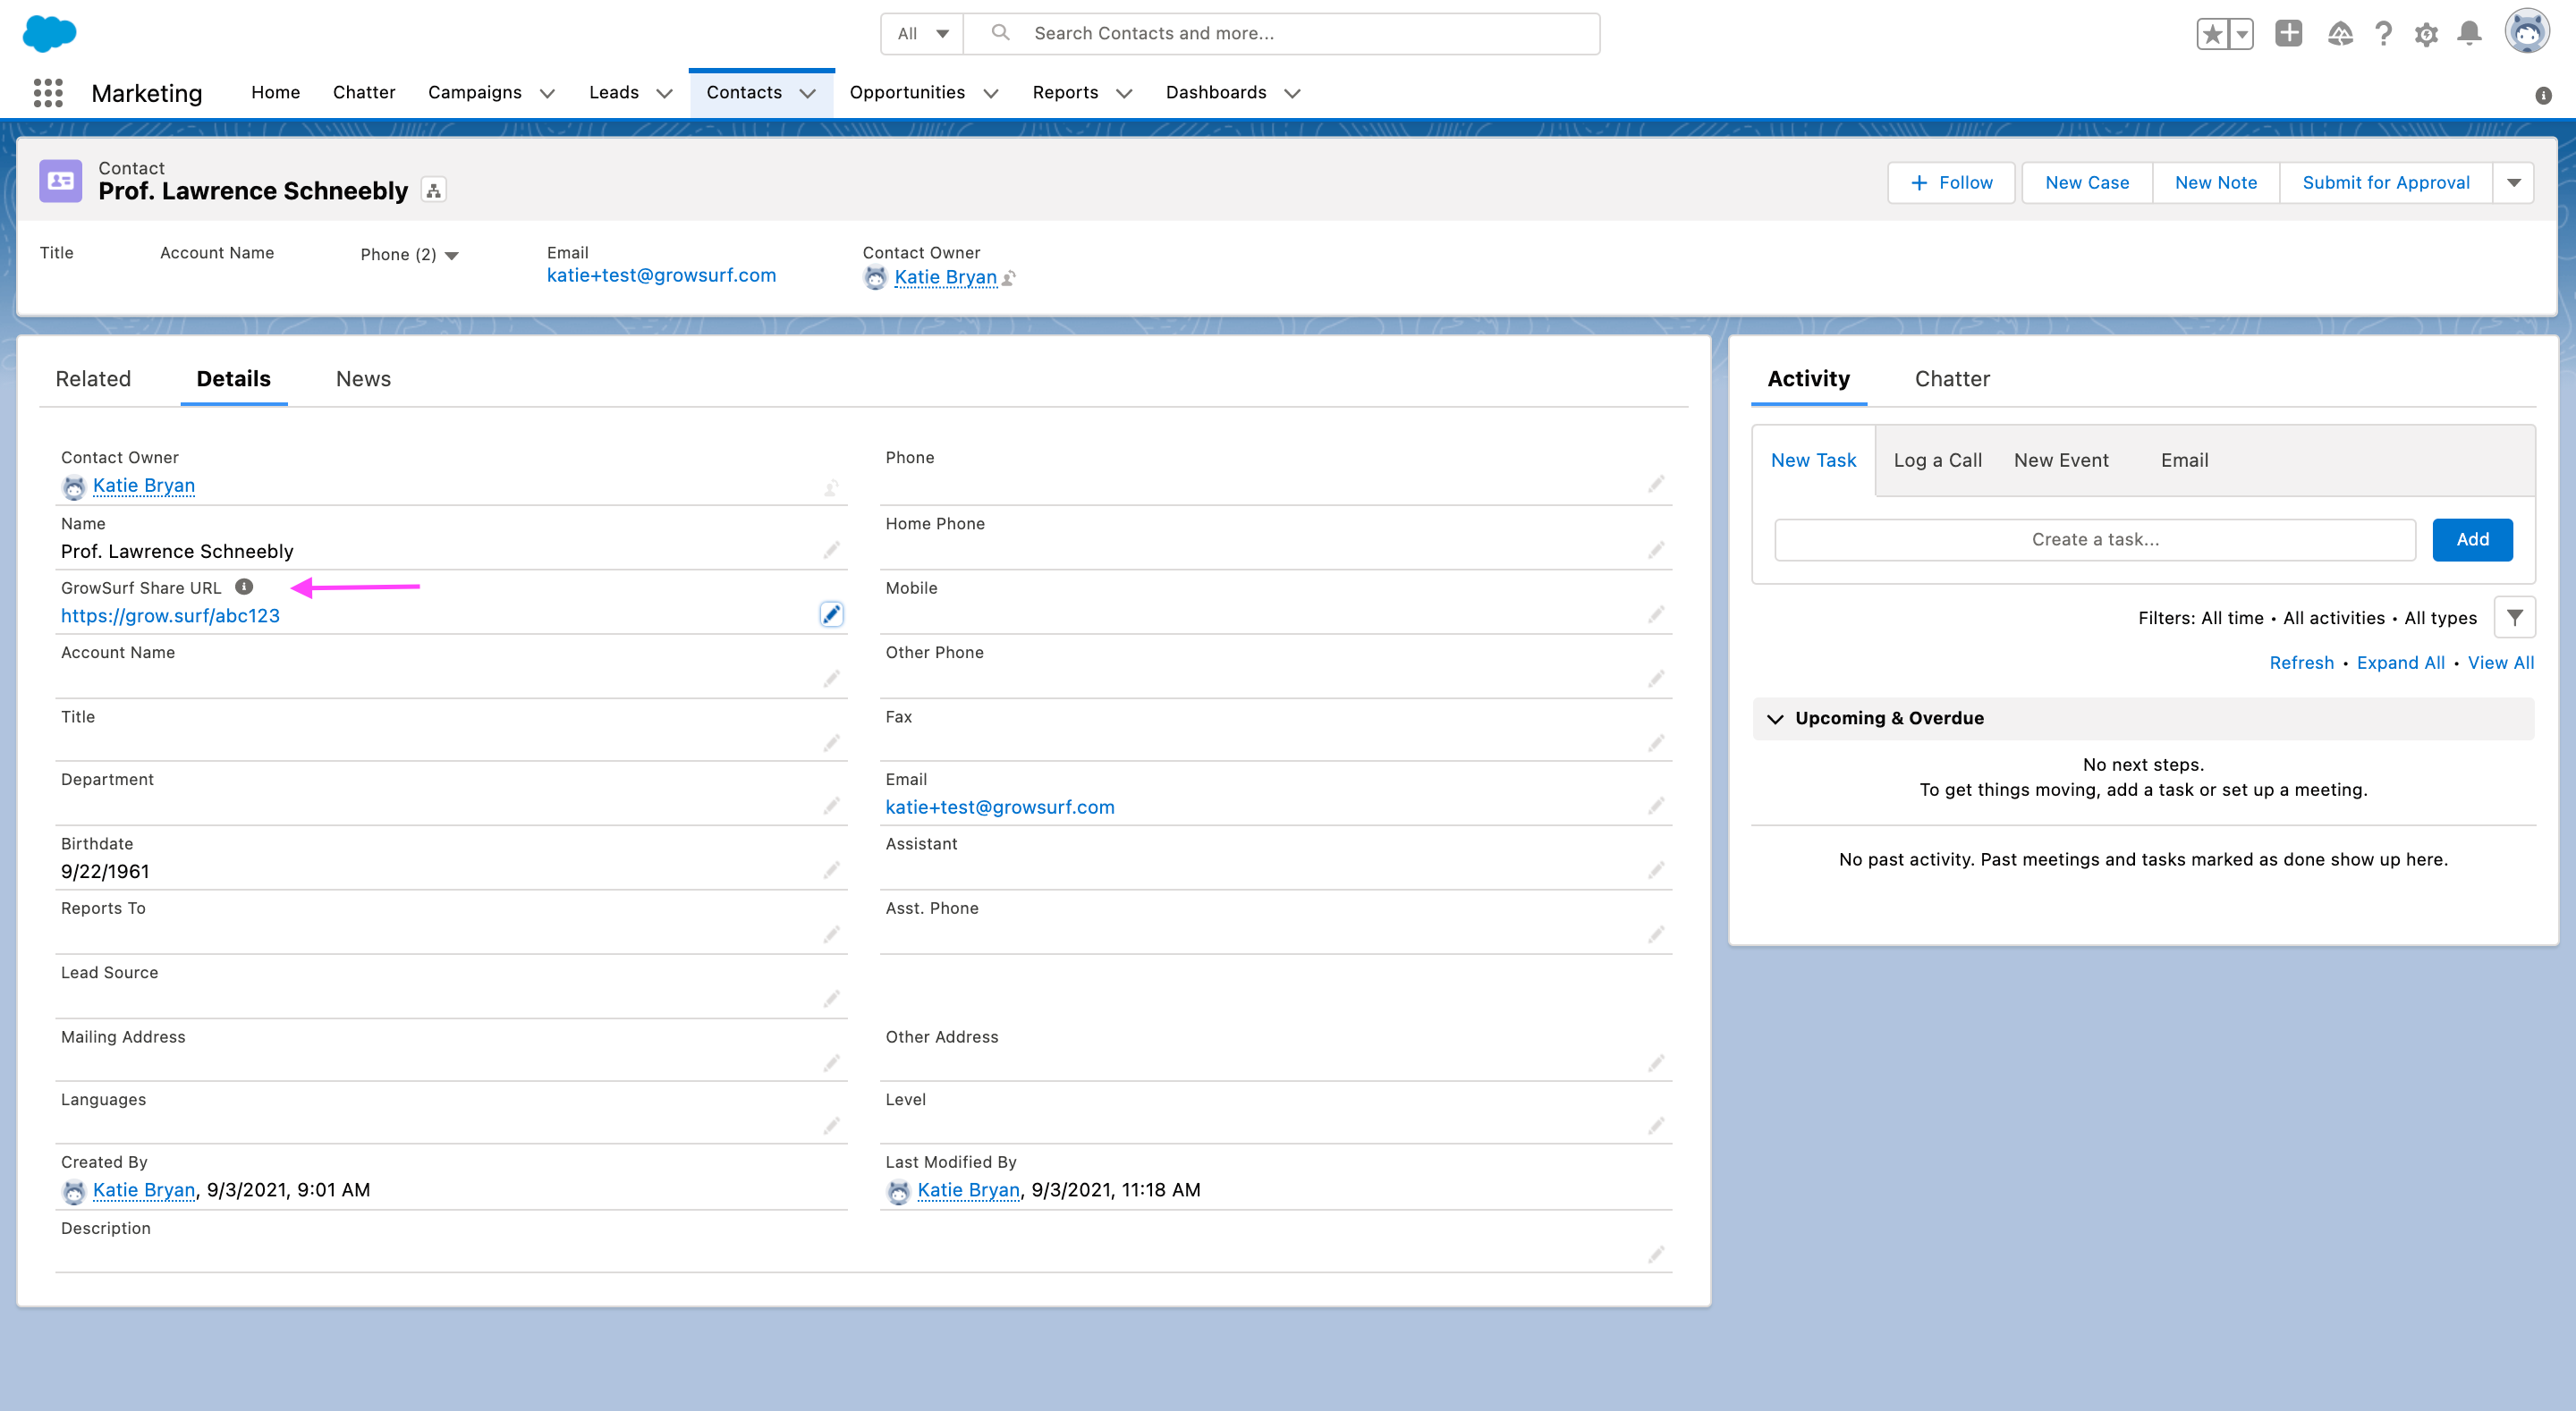
Sync GrowSurf referral fields into Salesforce contacts so sales and success teams can see share links, referral status, and referrer context without manual exports.
View Guide →Use GrowSurf's Salesforce Referral Trigger to credit referrals when an opportunity reaches the stage that actually matters to your pipeline.
View Guide →
Use the native HubSpot sync so your team can see share links, referral status, and referrer details on the contact record.
View Guide →Yes. GrowSurf's native Salesforce integration already syncs the contact fields you need for filtering and reporting. Once those fields are visible in Salesforce, you can use normal Salesforce reporting tools to build list views, reports, and dashboards.
No. Contact-field sync is enough if you want referral context on Salesforce contacts. Turn on the Referral Trigger only when you also want an opportunity stage change to count as the qualifying referral event inside GrowSurf.
No. Fix the issue in GrowSurf or in the report logic instead. The GrowSurf custom fields should stay system-managed so the dashboard always reflects the same referral data GrowSurf is using for credit and rewards.
Trusted by marketing and product teams at fast-growing B2C, fintech, and SaaS companies
Successfully submitted!
Error! Please try again
See referral programs that our customers have implemented.
