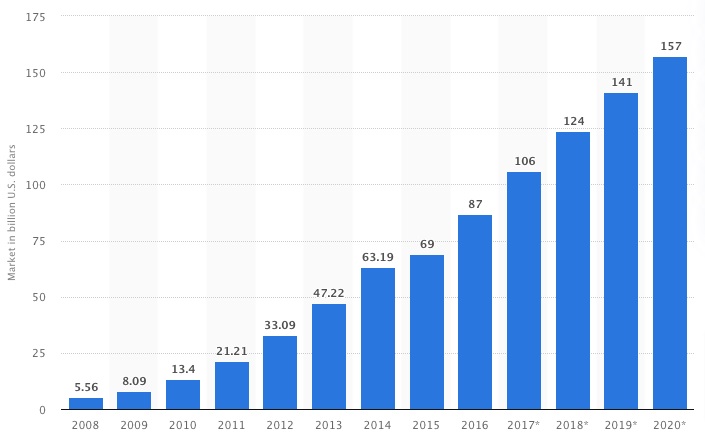
The SaaS market is huge – and it's only getting bigger. According to the BVP Nasdaq Emerging Cloud Index, the SaaS market grew by over 200% between 2017 and 2022. With businesses increasingly adopting cloud-based software solutions, the SaaS industry is projected to reach $716.52 billion by 2028, growing at a CAGR of 25.6% from 2021 to 2028.
Clearly, it's a great industry to be in right now. But it's definitely not a license to print money. Whether you're looking to start a business in the SaaS niche or you're an established player, it's vital that you understand what a healthy company looks like. That means you need to track a bunch of metrics. As Tomasz Tunguz, a SaaS investor and advisor, emphasizes, "Metrics are the scoreboard for a SaaS business. They measure the health of a business and its potential for future growth."
This is a guest contribution by Freya Kuka, personal finance blogger at Collecting Cents.
Here are ten of the most important SaaS metrics you should be focusing on, spanning the categories of acquisition, engagement, retention, growth, and financial metrics for a comprehensive view of your business health.
Metric #1: Monthly Unique Visitors
As far as acquisition metrics go, monthly unique visitors is a good starting point. Monthly unique visitors is exactly what it sounds like – the number of unique users who land on your site in a month across all traffic channels, from organic search to paid social and email marketing. As HubSpot notes, "Qualified marketing traffic consists of people who are most likely to become future or recurring customers. Being able to differentiate between these two groups will allow you to accurately track traffic growth each month, with a keen eye on qualified marketing visitors, as opposed to returning customers."
You can then go on to track what sort of posts and emails work best for traffic generation. For example, a good abandoned cart email could bring in not only website visits but also potential sales. Additionally, as Stripe recommends, "SaaS-Unternehmen können die Lead-to-Customer-Rate oft zusammen mit anderen Metriken verwenden, wie qualifizierte Marketing-Leads (MQLs, Marketing Qualified Leads) und qualifizierte Vertriebs-Leads (SQLs, Sales Qualified Leads), um die Lead-Generierung und -Konversion vollständiger abzubilden." Tracking leads through the funnel can provide valuable insights into optimizing acquisition efforts.
Generally speaking, a unique visitor is one single person. The only exceptions to this can come when different devices or browsers are used by the same person for multiple visits, or when someone deletes their cookies between visits. However, as HubSpot cautions, "While monthly unique visitors is a useful rule of thumb measure, you should also keep an eye on engagement metrics within the 'Behavior' section. Behavioral analytics will tell you how often users head deeper into your site, rather than leaving after viewing a single page."
Despite these minor complications, monthly unique visitors is still a strong gauge of the total size of your audience, which makes it a useful way to assess the strength of your marketing efforts. While monthly unique visitors is a useful metric, it's important to track other acquisition metrics like customer acquisition cost and lead-to-customer rate to fully understand the effectiveness and profitability of your marketing and sales efforts.
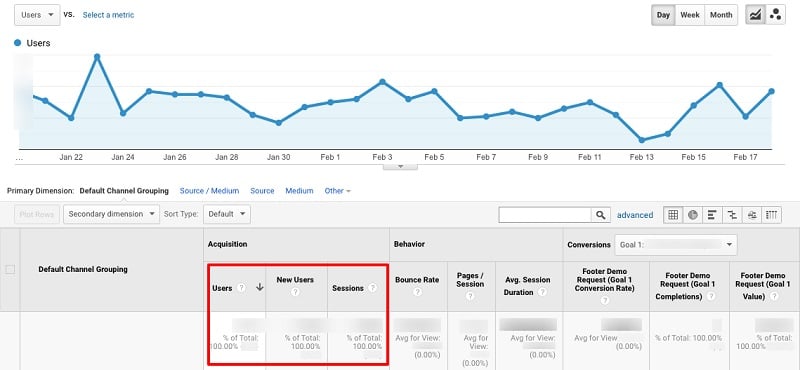
While there are a bunch of tools that allow SaaS businesses to measure traffic, Google Analytics is the most popular (partly because it's free). You can find all the information you need about unique visitor numbers by heading to: Acquisition, All Traffic, Channels. However, as HubSpot recommends, "There are a number of ways to identify qualified traffic versus returning customers. One way to do so is to use event tracking to count each time a visitor reaches a log-in screen or clicks the link in the navigation. Another way is to use in-app analytics to identify log-ins and usage per month." Leveraging these techniques can help you better segment and analyze your traffic data.
While we’re here, it’s worth explaining what those three “Acquisition” metrics refer to within Google Analytics:
Users: The number of unique users who’ve visited your site during the chosen date range
New Users: The number of first-time visitors to your site during that period
Sessions: The number of times all users – unique and non-unique – actively engage with your website within your specified timeframe
It's also important to track these metrics over time to identify trends and patterns. As Stripe advises, "By monitoring these metrics, SaaS businesses can identify areas of improvement, optimize their marketing and sales strategies, understand customer behavior, and make data-driven decisions to increase customer acquisition and revenue." Regularly analyzing these acquisition metrics can help you make data-driven decisions to improve your marketing and sales strategies.
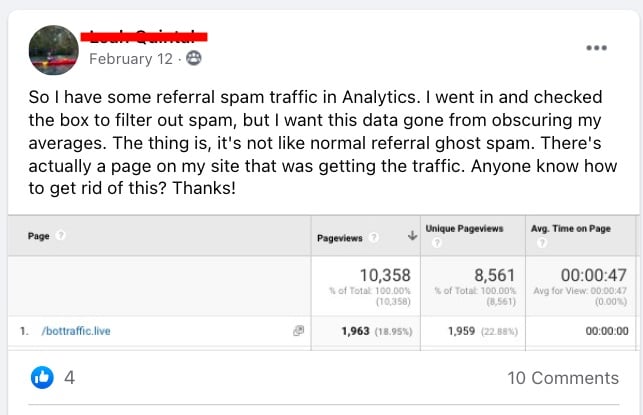
Another recommendation is to make sure that these monthly visits are authentic and of verifiable quality. To give you an example, my site and a bunch of others were recently targets of spam referral traffic. It was discussed in multiple Facebook groups and plenty of people reported having a similar problem:
As HubSpot advises, "You do not want stuff like this to affect your general traffic calculations. Learning how to avoid spam traffic in Google Analytics and even learning how malware works in general could be helpful." Ensuring the quality and authenticity of your traffic data is crucial for making accurate decisions based on these acquisition metrics. Using tools like Google Search Console can help identify crawling and indexing issues that may lead to inauthentic traffic.
Engagement Metrics
There are lots of other metrics you’ll want to pay attention to on this page too. While monthly unique visitors is a useful rule of thumb measure, you should also keep an eye on engagement metrics within the “Behavior” section. Behavioral analytics will tell you:
How often users head deeper into your site, rather than leaving after viewing a single page
How many pages they visit per session
How long they spend on your site
As HubSpot explains, "As well as bringing in a high volume of monthly unique visitors, you want those visitors to be engaging with your site while they're there and clicking toward your most valuable, highest-converting pages or opt-in forms." Tracking engagement metrics can help you understand how effectively your content is resonating with visitors and driving desired actions.
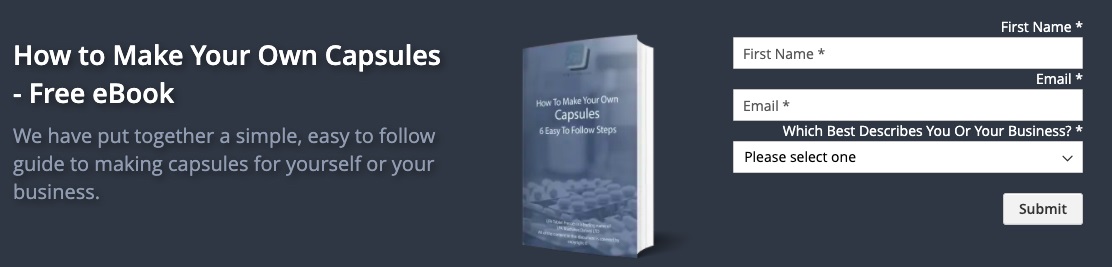
This would mean you not only want to build traffic but you also want traffic that converts into leads or sales. For example, LFA Capsule Fillers has an opt-in form on their homepage that offers an ebook freebie:
It is far more profitable for their company to bring in 10 freebie sign-ups that they can add to their email list (and then nurture) versus 100 monthly site visitors.
Keeping track of both will give you deeper insight on your readers.
Metric #2: Signups
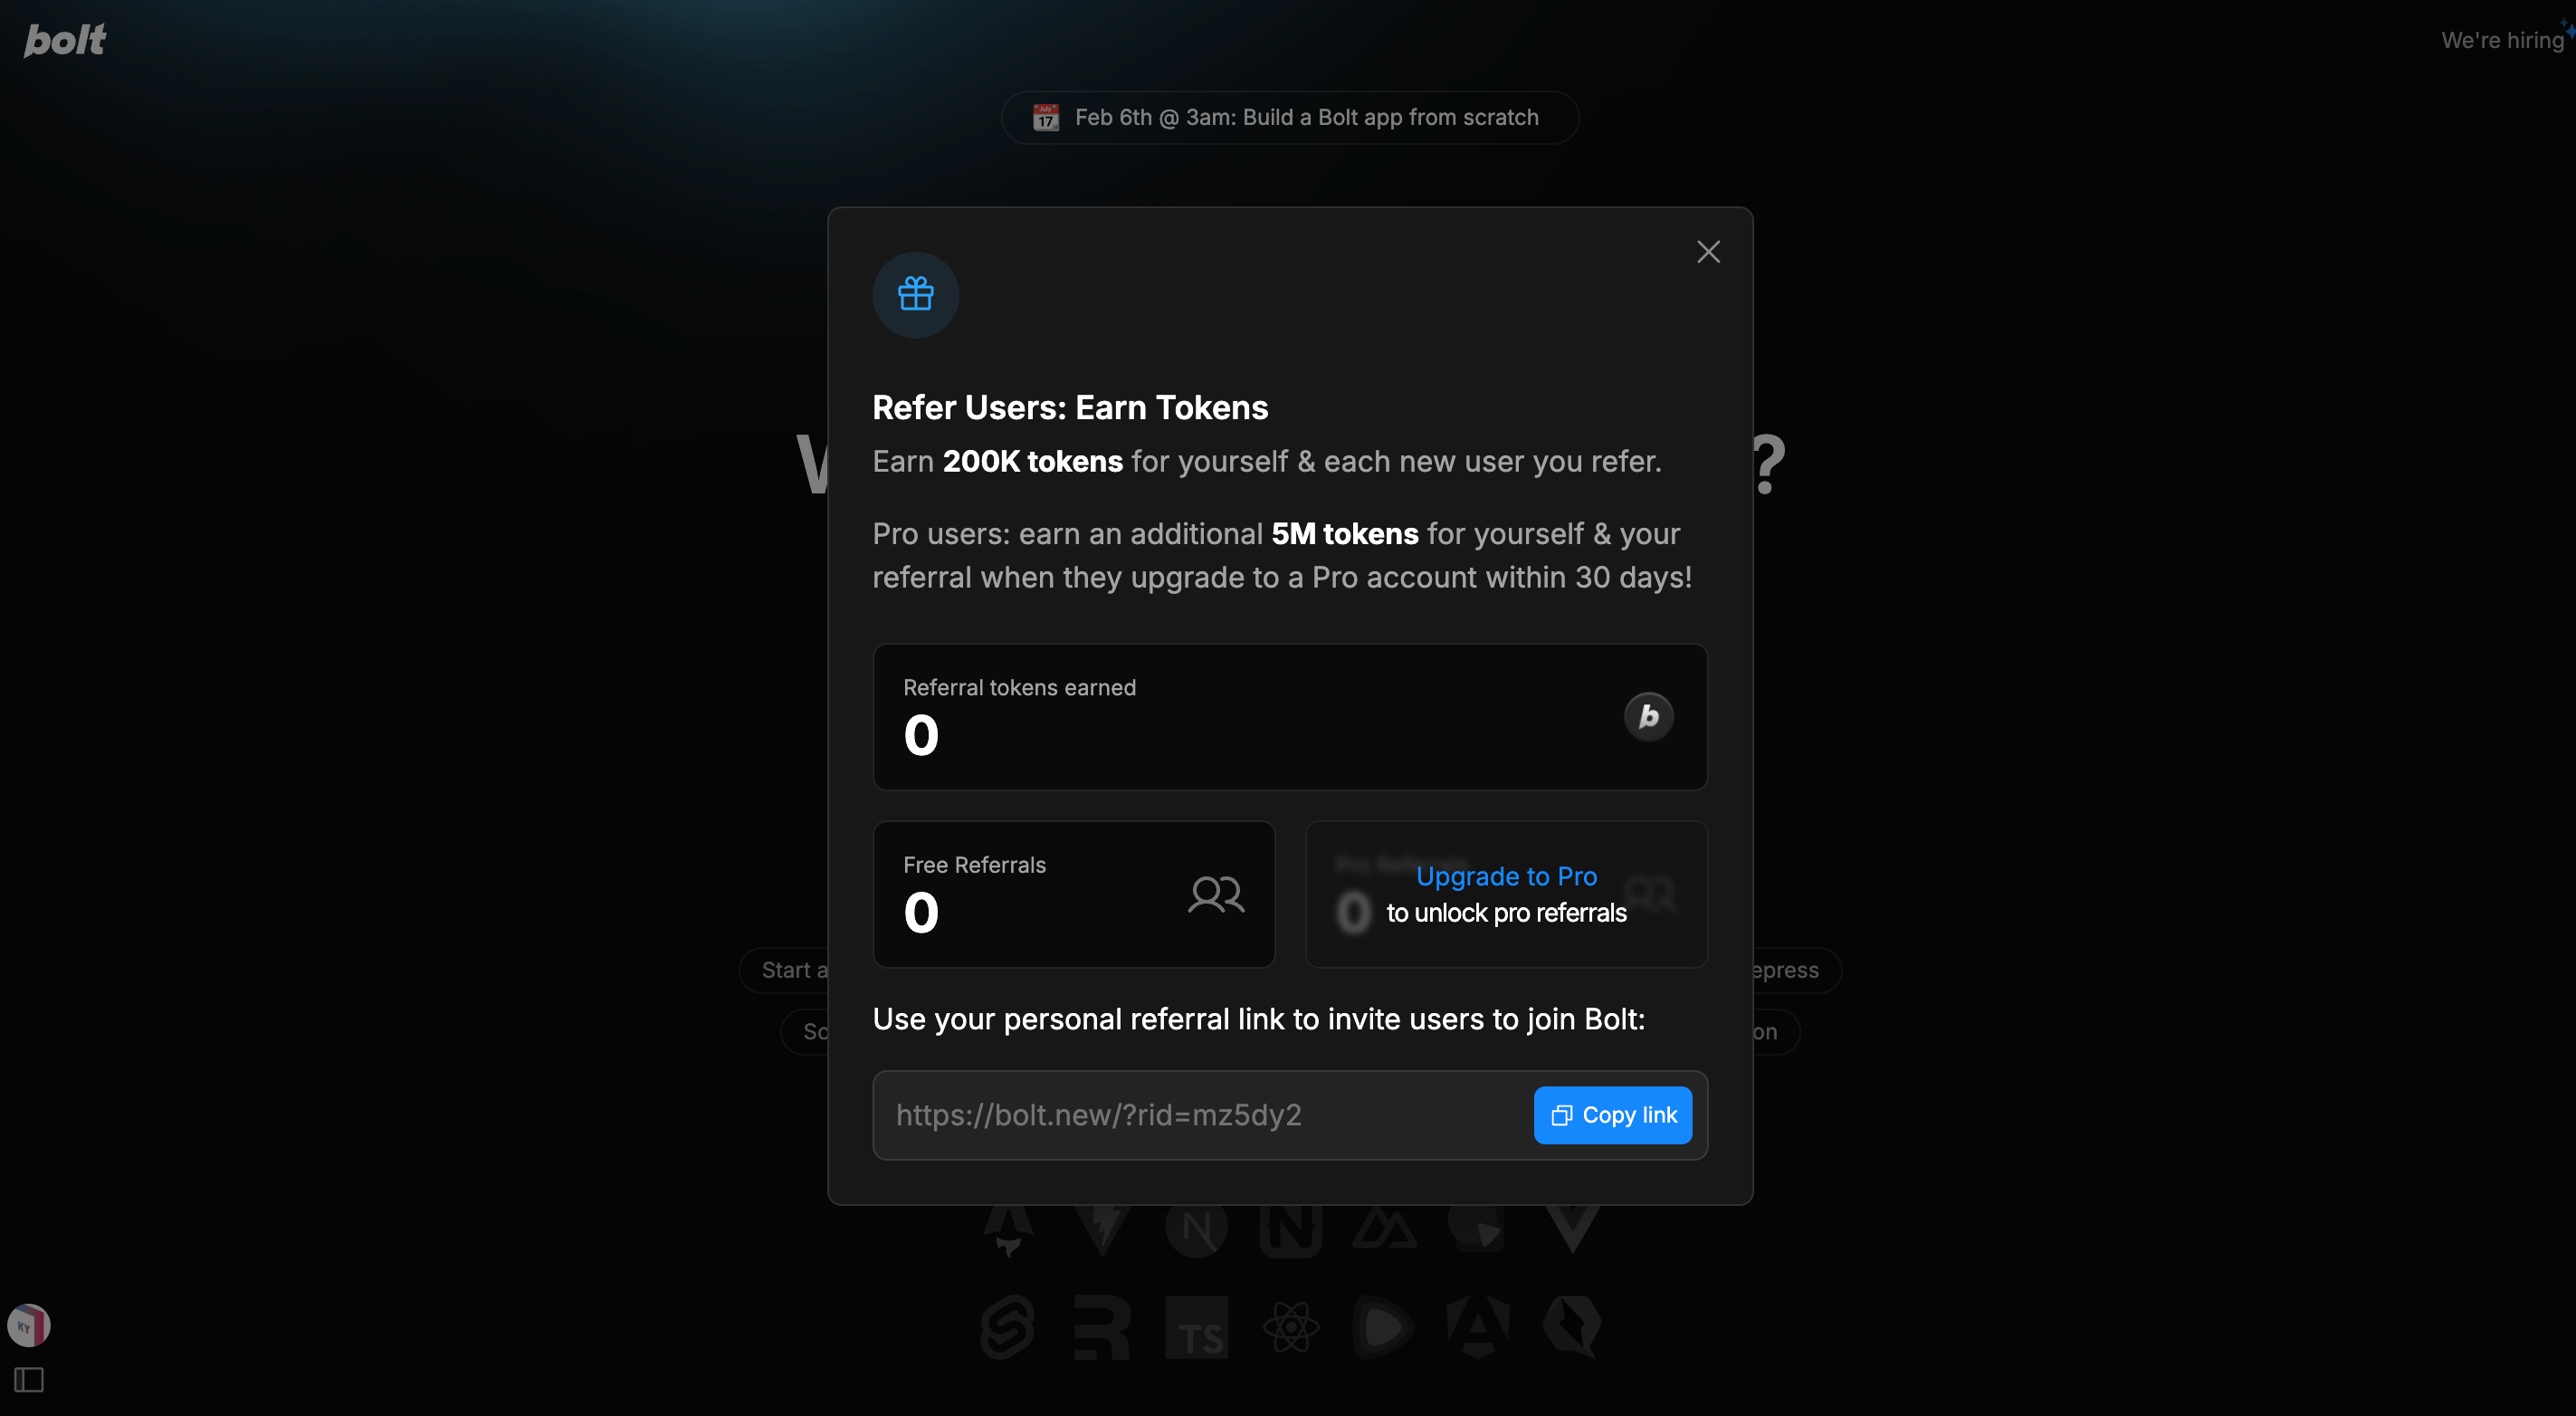
A growing number of SaaS businesses offer some kind of self-service purchase option, whether that’s a free trial or an end-to-end signup.
For example, Aura, an intelligent repricing service has a completely automated service that lets customers start with a 14 day trial, create an account, and select a pricing structure to continue. Pretty much everything is automated and you can send in a help request if you have questions.
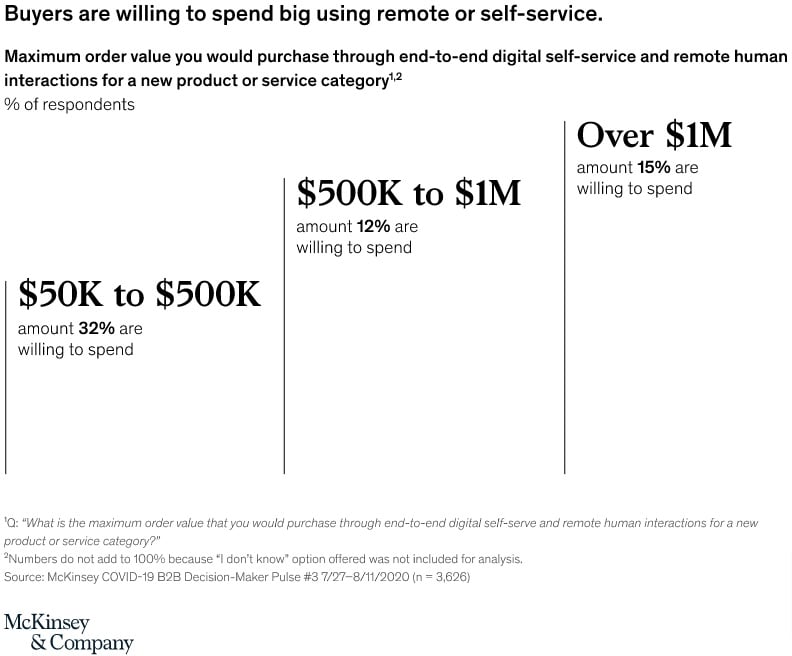
That’s a good thing, because evidence shows B2B buyers love autonomy. Indeed, 70% say they’d be open to spending more than $50,000 on a fully remote or self-serve purchase.
If your business offers a self-service purchase model, signups are probably your most critical SaaS metric. It’s a measure of how effectively your marketing team is promoting your product, highlighting its key features and benefits, and relating them to the pain points of your target audience.
If your company offers services that need more hands-on guidance for your customers, you should also be measuring how your sales team is performing. Many things can go unnoticed when your employees are working remotely. Consider creating compensation packages that reward sales employees that close deals with efficiency.
If your volume of signups is not what you expected, consider employing different techniques that could help you improve it. Simple things like creating buyer personas, working on user segmentation or fine tuning your onboarding process could improve your numbers.
Again, there are lots of ways you can keep track of signups and where they come from. Most companies use goal tracking in Google Analytics, but you could use analytics tools like Mixpanel. Alternatively, you could use a landing page builder like Hubspot or Unbounce if you’re aiming to track conversions and create lead gen pages.
Of course, not all businesses can survive on end-to-end digital self-service models. In some cases, more personalization might be required or you might even need to assign a member of staff to each new customer. This typically applies to high-value and personalized services like custom software solutions.
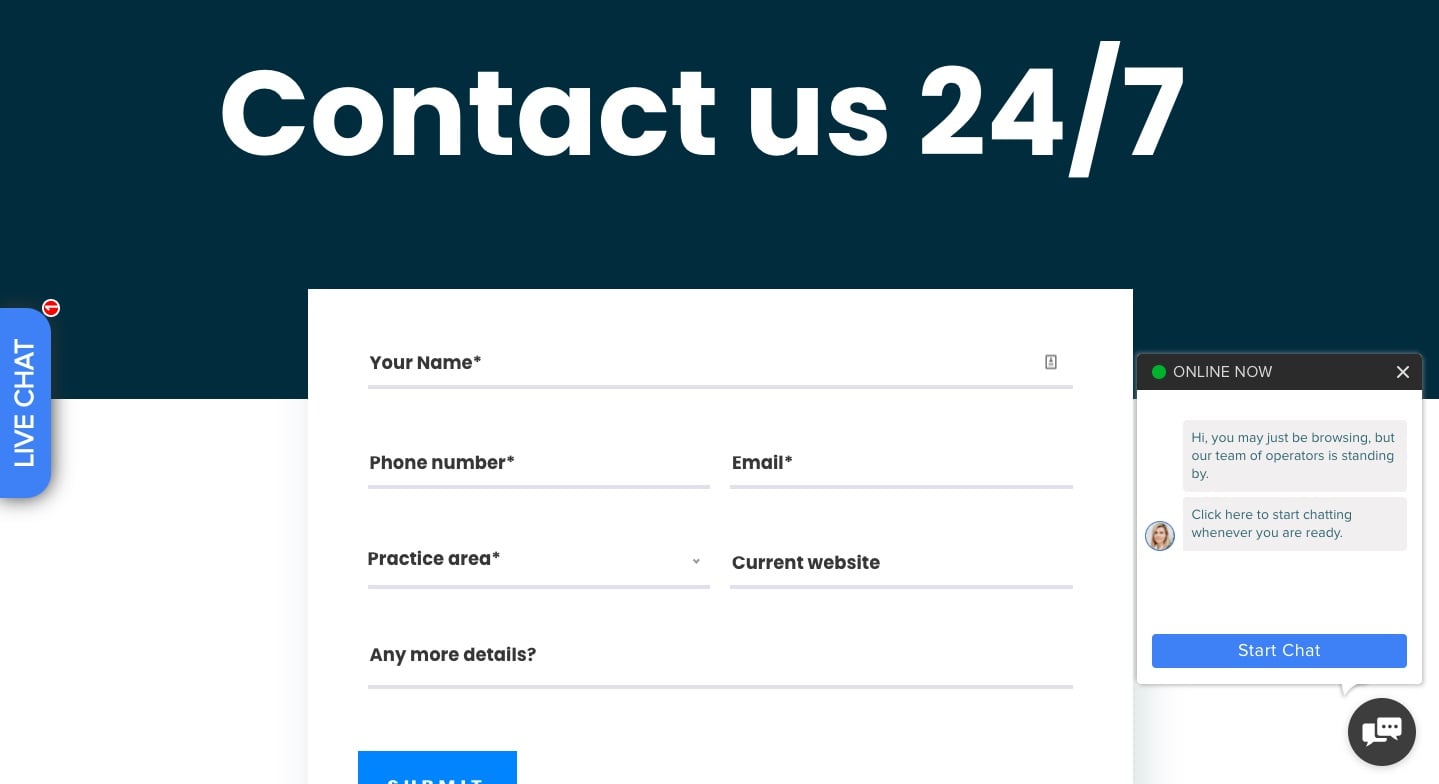
For example, LawRank (an SEO company) uses contact forms (that allow customers to add specific details) and live chat to bring in new leads.
These kinds of signups are easier to track but need more effort to convert into customers.
Metric #3: Customer Acquisition Cost
We’ve already discussed the end result of your sales and marketing activities – signups.
But how much is it costing you to win those signups?
This is where customer acquisition cost (CAC) comes in. Unless you understand how much you’re investing to bring in each customer, you can’t accurately assess whether you have a sustainable, scalable business model.
Fortunately, calculating CAC is simple:
Add up your total sales and marketing spend, including personnel costs
Divide it by the total number of customers you added during a set period, such as a year
For example, if you won 500 new customers last year and spent $50,000 on sales and marketing, your customer acquisition cost is $100. You could also simultaneously track where those customers came in from (referral marketing, organic search traffic, social media, etc). This will help you understand what you should focus on more.
However, you should keep in mind that this cost will differ based on your industry. For example, a SaaS startup that has a lot of customer onboarding steps automated will spend less on customer acquisition than a personal injury law firm.
In itself, that number might not tell you very much. The next two metrics are about adding context to your CAC.
Metric #4: Time to Recover CAC
You know how much it costs to acquire each new customer. Now it’s time to assess how long it takes you to recoup those costs. In other words, how long it takes for an account to become profitable.
For best results, you’ll want that timeframe to be as short as possible and you want it to decrease over time. If you don’t start to generate a real return from your customers until a year after they sign up, that puts a lot of pressure on you to retain them. If a bunch of clients cancel after just a couple of months, that could do a lot of damage to your business.
To calculate time to recover CAC, you’ll first need to work out your monthly recurring revenue (MRR) and gross margin (more on these later). Divide your CAC by the product of multiplying those two figures.
Or, to state it as a formula, time to recover CAC = CAC / (monthly recurring revenue x gross margin).
Metric #5: Customer Lifetime Value to CAC
By this point, you’re measuring not just your CAC, but how long it takes you to recover your initial acquisition outlay.
The next step? Getting a real-world understanding of how much you actually earn from your customers, and comparing this figure to your acquisition cost.
To do this, you first need to calculate your average customer lifetime value (LTV). This is actually pretty simple for SaaS companies, which typically have fixed subscription fees. Multiply your average revenue per user (more on this later) by the average length of time you retain customers, and you’ve got your LTV.
Customer lifetime value to CAC is expressed as a ratio. For instance, a ratio of 2:1 would mean you earn twice as much from a customer as you spend on acquiring them in the first place.
As a general rule, you should be aiming for a CLV:CAC ratio of at least 3:1. If yours is significantly lower, that’s a clear sign you’re spending too much to acquire customers.
High churn is a SaaS brand’s worst nightmare. It represents the number of customers who leave during a given timeframe, which means it’s a good indication of how happy your customers are, and how much value they’re getting from your product.
Customers churn for a lot of reasons, and some degree of churn is inevitable. For instance, you might have a lot of legacy customers spending much less than your newer accounts; losing those customers isn’t necessarily a bad thing. It could even be a positive, enabling you to focus more attention on acquiring and retaining more profitable clients.
A “good” churn rate will naturally vary from business to business. If you charge a very low subscription fee and have tens of thousands of customers, you’d likely be satisfied with a higher churn rate than a company with just a handful of big accounts.
That said, experts tend to agree that a rate of around 5% is acceptable for SaaS businesses, and that anything below 3% is strong.
To make things more confusing, SaaS companies measure churn in different ways. Some track the percentage of revenue they lose through cancellations in a given month or year, whereas others prefer to track the number of customers they lose.
It’s always a good practice to have a clear understanding of how churn rate affects your business metrics and follow the most suited way. You could also consider investing in tools such as Profitwell that help you track your churn rate more effectively. Monika Adarsh, Senior Marketing Manager at Beaconstac says Profitwell has helped them in a great way in visualizing their churn rate for their QR Code Generator over the years and focusing on ways to reduce it.
Given that SaaS companies typically have fixed subscriptions, and therefore should earn similar revenues from each account, most favor tracking customer churn.
To calculate yours, subtract the number of customers you have at the end of a month (or year) from the number you had at the start of that period, then divide it by the number of customers at the beginning of the period.
For instance, if you had 100 customers at the start of the month and 90 by the end, your customer churn rate would be 10%.
Metric #7: Gross Margin
It’s all well and good having thousands of customers, but are you actually generating a decent return from them?
Calculating your gross margin will help you answer that question. It’s a good measure of your company’s efficiency.
Much like churn, there’s no such thing as a “good” profit margin. Some industries naturally have much higher margins than others.
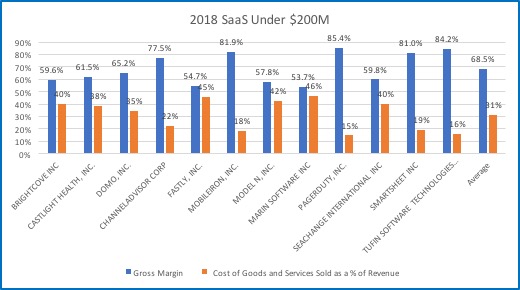
But because SaaS products offer a high degree of user autonomy, they typically don’t require a ton of work on the vendor’s side to maintain accounts over time. That means gross margins tend to be pretty high; one study analyzing a variety of SaaS businesses with revenues beneath $200 million recorded margins ranging from 54% to 85%.
To calculate your gross margin, subtract the cost of sales from total revenue, then divide that number by your total revenue.
Metric #8: Lead-to-Customer Rate
Every SaaS business would love to increase its conversion rate. But to do that, you need to understand how many leads you’re converting into deals at the moment, and track it over time.
With that in mind, lead-to-customer rate is a helpful SaaS metric to track because it tells you how many of your leads turn into paying customers. That’s a strong indication of whether your marketing team is bringing in leads of the right quality, and how well your sales process is functioning.
This metric is easy to calculate. Just choose a time period – say, a month – and take the number of customers you won during that period, then divide it by your total number of leads, and multiply that by 100 to express it as a percentage.
So for instance, if you closed ten deals in a month from 200 leads, your lead-to-customer rate would be 5%.
Metric #9: Monthly Recurring Revenue
How do you determine the typical rate of return on your website or product? By calculating your monthly recurring revenue (MRR).
While no two SaaS businesses are completely alike, recurring revenue is always vital. It’s how you plan for the future, grow your workforce, and reinvest in your product.
There’s nothing complicated about calculating your MRR – it’s simply a matter of adding up all the revenue you receive from your paying customers every month. This is an especially important metric for industries that are selling expensive services such as business insurance, medical supplies, machinery, etc.
Metric #10: Average Revenue Per User
Average revenue per user (ARPU), also called average revenue per account, is the amount of revenue you earn from each customer during a given time period. For SaaS businesses, this is typically measured over a month’s time.
For some SaaS businesses, ARPU will be pretty low, so growth will come from having a big customer base and signing up a lot of new accounts each month. That’s how companies like Calendly and Dropbox do it. Others will have a very high ARPU and a much smaller number of users. Whatever the case, you’ll want your average revenue per user to be consistently increasing over time.
The simplest way to calculate your ARPU is to take your monthly recurring revenue at the end of a month and divide it by the number of customers you had during that month.
So if your MRR is $50,000 and you have 1,000 customers, your average revenue per user is $50.
Wrapping It All Up
As you’ve likely realized, there’s no single SaaS metric that’ll tell you everything you need to know about the health of your business.
Your monthly recurring revenue might be sky-high, but if your margins are super tight, you won’t be making much profit (or any at all).
Or you could be signing up a ton of customers every month – but if your CAC and churn rate are through the roof, all those new accounts won’t be making a positive impact on your bottom line.
That’s why you need to track a wide range of SaaS metrics to get a clear picture of what’s really going on and put plans in place to drive business growth.
GrowSurf is modern referral program software that helps product and marketing teams launch an in-product customer referral program in days, not weeks. Start your free trial today.
GrowSurf is modern referral program software that helps product and marketing teams launch in-product referral and affiliate programs in days, not weeks.
Referrals marketing works because it's based on human psychology. Customer referrals will still be effective 100 years from now and here's exactly why.
One good way to create a successful referral program is to look at how other people did it. Case in point: Morning Brew. Want to learn how they built an audience of 2.5 million? This blog post breaks down the Morning Brew referral program in detail!
What is a viral loop? Simply put: Enticing existing customers to refer your product to others. Learn how to influence your customer base for sustainable growth.


 Salesforce
 Stripe
 HubSpot
 Chargebee
 Recurly
 PayPal
 Tango Card
 Webhooks
 Zapier